Vehicle Registrations: An Economic Indicator?
Every year Hoosiers register their vehicles so they can drive legally and so the state can collect vehicle excise taxes and registration fees. Can we extract any economic insight from such a routine activity? Yes, but bear in mind that vehicle registrations, if they are to be used as an economic indicator, will be most useful when viewed in relation to other statistics.
As shown in Figure 1, Indiana posted its largest yearly decline in registrations last year with 186,314 fewer vehicles registered, a decline of 3.2 percent. Nearly 90 percent of the decline can be attributed to the decline in passenger car registrations. Declines in truck and car registrations were offset by increases in trailer, motorcycle and other components of total registrations. Fewer registrations are likely due to an oversaturated market and the economic uncertainty that weighed on consumers throughout 2003. Excise taxes in Indiana may also have played a part as people registered only the cars they must use for their transportation needs and excluded vehicles used strictly for recreation.
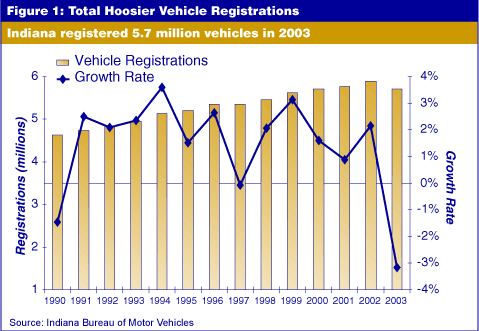
Of course, Figure 1 may not tell the whole story. Anecdotal evidence suggests that some people living in Indiana may register their cars out of state, or hold onto another state’s registrations even after moving to Indiana, perhaps to avoid excise taxes. Therefore, the number of resident cars may be different than the number of registered cars. In fact, Utah reported in October 2001 that 2.8 million in state revenues are lost each year due to vehicles that should be registered in Utah but are inappropriately registered in other states.(1)
Fewer New Cars
New car registrations (model years 2003 and 2004) for popular U.S. and foreign makes (2) dropped off from 2002 to 2003 by 10.2 percent, or 25,501 cars (see Figure 2). Note that car registrations exclude trucks and SUVs registered as trucks. Hoosiers prefer Chevrolets and Fords, which comprised about 30 percent of new car registrations.
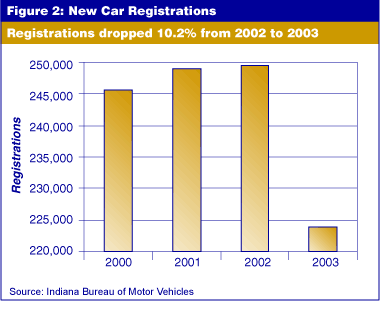
The fact that Hoosiers bought or leased fewer new cars in 2003 may be due to a wait-and-see attitude as economic uncertainty remained high and consumer confidence stayed low. For example, outside of October, Indiana had lower levels of total non-seasonally adjusted nonfarm jobs in the second half of 2003 compared to 2002.
Newer and Older Cars
In 2003, registrations for newer cars (model years 2000, 2001 and 2002) increased by 11,108—the largest yearly increase since 2000. Some of these vehicles may be coming off lease, some may be cars that dealers still had in their inventory and were newly purchased, and others may be the result of people moving into the state. A net migration figure of 12,166 people coming into the state from 2002 to 2003 seems to support the latter.
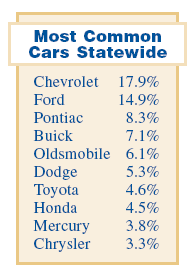
Since financing terms usually span three to five years, it is not surprising that most Hoosiers are driving older model years. In fact, 72 percent of registered cars had a vehicle year of 1999 or earlier. In 2003, the most common older Hoosier cars on the road were Chevrolets (18.6 percent) and Fords (15.2 percent).
In 2001, there was a decline of 35,060 in older vehicles being registered in Indiana (vehicle years 1997 or earlier). “Keep America Rolling” financing incentive campaigns in the fall of 2001 may have led Hoosiers to dump their old clunkers for a new car at 0 percent APR for 60 months.
However, there was a net gain of 27,722 (or 1.2 percent) in the number of older vehicles registered between 2000 and 2003. Growth in older used vehicle registrations in the past two years could be argued as good or bad—good for used car dealerships and motor vehicle parts and repair shops, but not so good for new car dealers.
Most Popular Cars
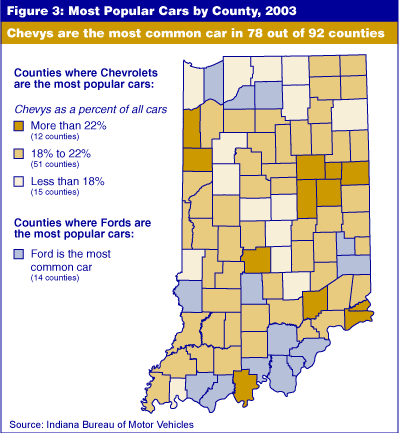
Chevrolets are the most popular cars among Hoosiers (see Figure 3). The highest concentration of Chevys is in east central Indiana (with a high in Madison County of 29 percent), while lower concentrations are found in the state’s larger cities. Also, Fords are notably prevalent within the Louisville metro area.
Hoosier Trucks and SUVs
Truck registrations in Indiana accounted for 24.4 percent of total registrations in 2003, some of which are sport utility vehicles (SUVs). The release of the Census Bureau’s 2002 Vehicle Inventory and Use Survey (VIUS), as part of the Economic Census, provides some additional insight. The Census Bureau estimates that the number of SUVs registered in Indiana increased 105 percent from 1997 to 2002 (note that truck registrations for the VIUS report includes those SUVs registered as passenger cars in Indiana). Out of the total 2002 truck registrations in Indiana, the survey found 25 percent were SUVs while 46 percent were pickup trucks. The report also found that Indiana has approximately one pickup truck for every four licensed Hoosiers and one SUV for every seven licensed Hoosiers. To access the VIUS report providing more detail regarding trucks and SUVs in Indiana, go to www.census.gov/svsd/www/vius/products.html.
Notes
- More on Utah’s findings are available at www.le.state.ut.us/audit/01_10rpt.pdf.
- The BMV file that provides detailed vehicle data has different reporting requirements from the total registration file discussed earlier.
Amber Kostelac
Data Manager, Indiana Business Research Center,
Kelley School of Business, Indiana University