Anatomy of Indiana's Job Losses
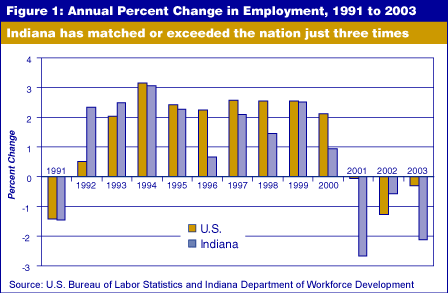
Much has been made of the jobs lost in Indiana. The number of jobs we have lost depends on where we start and where we end. For example, Figure 1 shows that Indiana's employment growth rate has matched or exceeded the U.S. rate in only three of the past 13 years.
If we put the nation and the state on an equal scale, as in Figure 2, Indiana's deficiency in job growth since 1990 totaled 176,600 jobs by July 2003.
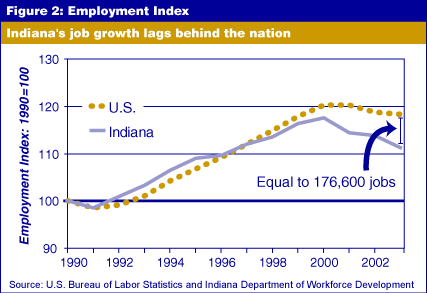
If we start with July 2000, the number of jobs lost has been 156,700. This is without reference to the differential between the rates of growth in the nation and the state. But that differential is of interest, because it may indicate the state's competitive advantage or disadvantage over time.
Another differential of interest is that arising from the state's particular industry mix. We are more extensively involved in manufacturing than the nation as a whole. Therefore, when we have a recession heavily concentrated in manufacturing, Indiana gets hit harder than other states, even though we may have a competitive advantage in that sector.
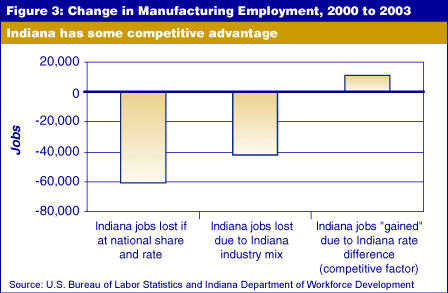
Let's see how this works using manufacturing as our example. In July 2000, Indiana had 664,700 manufacturing jobs. This was 22.4 percent of all the jobs in the state. But at the national level, manufacturing accounted for just 13.1 percent of all jobs. If Indiana had the national mix of jobs, we would have had just 390,600 jobs in manufacturing. Then, if we experienced the same percentage decline in manufacturing jobs as did the nation between July 2000 and July 2003 (-15.5 percent), we would have lost 60,700 manufacturing jobs.
How many manufacturing jobs did we actually lose? We lost 92,200. Thus, about two-thirds of the lost manufacturing jobs in Indiana can be associated with the national decline in manufacturing employment. What about the other jobs lost in Indiana? These losses were the result of two factors: our differential in the mix of jobs and the difference in our competitive position in manufacturing. When we take into account Indiana’s heavier concentration in manufacturing (while still holding the job-loss percentage at the national rate of -15.5 percent), then we lost an additional 42,500 jobs in manufacturing.
Together, these numbers add up to 103,200 jobs, but Indiana lost only 92,200 manufacturing jobs. Why this difference? The answer lies in the fact that our percentage loss was -13.9 percent, resulting in a "gain" of approximately 11,000 jobs, due to what is often termed a state's competitive advantage. In truth, it may only be a difference in mix at lower levels of aggregation, but it does feel good to ascribe this residual factor to something positive like a competitive advantage.
Figure 3 decomposes the change in Indiana's manufacturing employment into its three parts. Whereas we might claim some competitive advantage for Indiana's manufacturing, the general picture is not as cheery. Manufacturing was the only one of thirteen industry groups to have a major positive competitive factor (see Table 1).
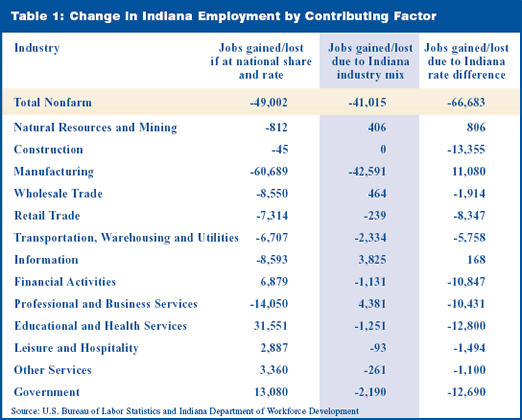
When the results for the individual industries are added together they form Figure 4. Here we find 31 percent of the jobs lost were due to the national factor, 26 percent due to Indiana's particular industry mix and 43 percent due to the competitive factor or the differential between Indiana's growth rate and that of other states.
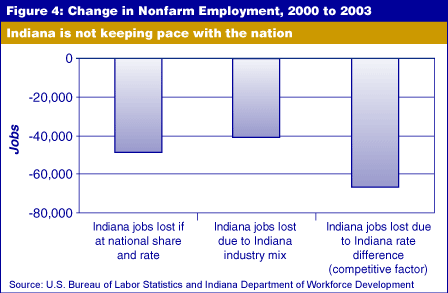
What do all these numbers mean? Simply what we have known for some time: Indiana is not keeping pace with the nation across a wide range of industries. Manufacturing is being hit nationally and, because we are heavy in manufacturing, we get hit hard by that national factor. However, manufacturing is not dragging the state down. This analysis shows that 66,700 of the 156,700 jobs lost in the past three years are the result of deficiencies in job growth in non-manufacturing. In fact, without the beneficial aspects of manufacturing in Indiana, we would have lost an additional 11,000 jobs.
Morton J. Marcus
Director Emeritus, Indiana Business Research Center,
Kelley School of Business, Indiana University
