Counts of Establishments Up, Jobs Down
Talk of job losses, plant closings and permanent layoffs can be heard throughout the state, as we move through this so-called jobless recovery. Indiana has been in this place before. During the 1980s, the economic buzz was about downsizing and modernizing. Manufacturing businesses took the buzz to heart. By the early 1990s, Indiana’s employment in this sector was under 600,000 and its share of all jobs in the state was shrinking. But the mid to late 1990s were boom years for the nation and Indiana, with jobs in manufacturing in this state once again totaling more than 600,000.
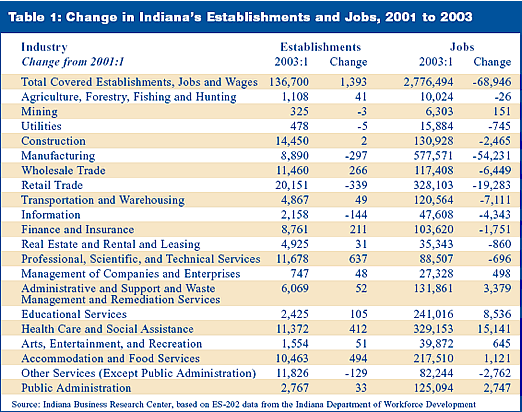
Today, the buzz is about advanced manufacturing, the integration of automated processes and the resulting gains in productivity with a smaller workforce. The dynamics of the economy are hinted at through numbers tallied in the covered establishment and payroll figures collected quarterly by the state. By the first quarter of 2003, the latest quarter for which we have covered payroll establishment counts, Indiana had lost close to 300 manufacturing establishments and 54,000 manufacturing jobs between first quarter 2001 and first quarter 2003.

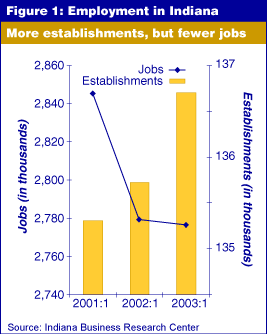
At the same time, Indiana saw an increase in the total number of business establishments (see Figure 1). More than 1,300 establishments were added to the count of covered payroll establishments (meaning they are covered by the unemployment compensation laws). The average weekly wage went up by $18 during those two years, but Indiana also saw job losses of nearly 69,000.
Bright spots in the data show that the professional, scientific and technical services sector had gains of 637 establishments at the same time that sector lost 696 jobs. Health care and social assistance added 15,141 new jobs and had 412 more establishments engaged in the business of that sector.
Importantly, this information is not survey-based—these are actual counts of establishments (by physical location), jobs and quarterly payroll as reported by employers. Some users refer to this data set as Covered Employment, Covered Payroll or even by the form code, ES-202. The Bureau of Labor Statistics official title is Covered Employment and Wages (CEW).
See Table 1 for highlights and go to STATS Indiana for more detail at the county level: www.stats.indiana.edu/cew.

Carol O. Rogers
Associate Director, Indiana Business Research Center,
Kelley School of Business, Indiana University
