Regional Patterns in Personal Income Growth
The latest data from the U.S. Bureau of Economic Analysis show that total personal income in the United States grew by 4.2% in the fourth quarter of 2000. (These data are seasonally adjusted at annual rates, not adjusted for price changes.) This was the slowest quarterly growth rate since the first quarter of 1999. Although slowing of the economy is evident, there is no indication of a recession in these data since the growth rate still exceeds the rate of inflation, which was 2.9% in the fourth quarter.
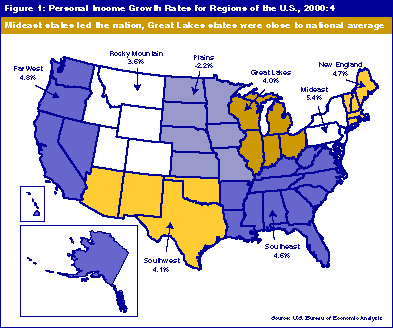
Across the nation, the rates of growth ranged from 5.4% in the Mideastern states to -2.2% in the Plains states. Personal income in the Great Lakes region, which includes Indiana, grew by 4.0% (see Figure 1). Indiana recorded a 1.8% advance in the fourth quarter, after jumping 6.7% in the third quarter and nearly 8% in last year's second quarter.
Click on map to see larger version.
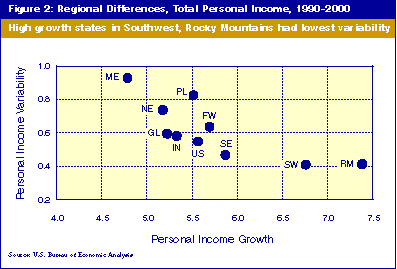
The high standing of the Mideast states in the latest data could be misleading. This region encompasses the District of Columbia plus five states, including New York and Pennsylvania. It experienced the lowest average rate of growth during the past 11 years and also had the highest degree of variability* in growth rates (see Figure 2). Since 1990, the best growth records were turned in by the Rocky Mountain and Southwest regions, which also had the lowest variability in growth rates. The Great Lakes states grew less rapidly than the nation with more variability than the U.S., but Indiana's 5.3% increase bested the region's 11-year average of 5.2%.

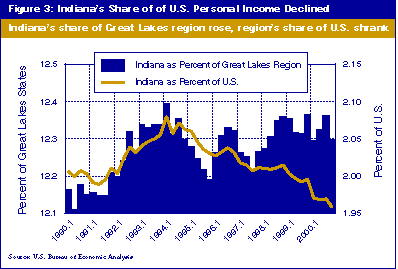
Indiana's position among its Great Lakes neighbors is worth noting. While it has been shown frequently that Indiana's share of the nation's personal income has fallen since 1994 (see right scale of Figure 3), the Hoosier state did well in comparison with some of the Great Lake states (see left scale of Figure 3).

During the early years of the last decade (1990:1 to 1994:1), Indiana's share of U.S. and Great Lakes personal income grew. There followed a period of decrease in the state's share of both aggregates, with more decline vis-à-vis the region than against the nation. But that pattern was broken in 1996. Since then, Indiana has increased and sustained a higher rate of growth than the region. Thus, while the state's share of the nation declined from 2.01% at the start of 1990 to 1.96% at the close of 2000, its share of the region advanced from 12.16% to 12.30%.
This finding suggests that, in direct competition with its neighbors, Indiana has performed well. But its region has lost ground in the nation, falling from 16.5% of U.S. personal income to 15.9% in 2000.
*Variability is measured by the coefficient of variation, which is the mean rate of growth divided by the standard deviation of those growth rates.
