Record Low Unemployment Rate Raises Questions
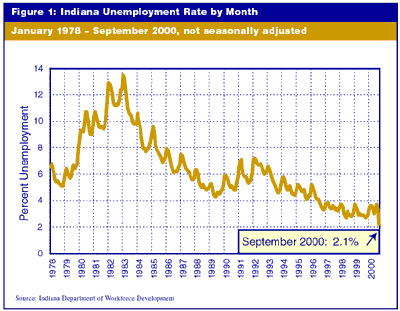
The unemployment rate in Indiana dropped to 2.1% for September, according to statistics released by the Indiana Department of Workforce Development. That's the lowest unemployment rate ever recorded in Indiana since the government began keeping track during World War II (see Figure 1).

But was unemployment actually that low? Or are we merely seeing some normal variation in the statistics, with no real change in unemployment? The question arises because the unemployment rate does not come from a physical count of unemployed people. Nor does it come from a count of all unemployment claims.
The percentage figure for the state unemployment rate is derived from advanced statistical formulas developed by the U.S. Bureau of Labor Statistics. The formulas take several factors into account, but they rely mainly on a monthly survey of a small sample of Hoosiers, conducted by BLS and the U.S. Census Bureau.
In other words, the rate is an estimate—a carefully calculated one, done by labor force experts, but it's an estimate. And it's an estimate based on a small sample size. So every month, there's a normal margin of error.
The Indiana Business Research Center in the Kelley School of Business at Indiana University analyzed these numbers, in cooperation with the Labor Market Information division at the Department of Workforce Development and with BLS. The results of this analysis indicate that the estimate for September may be farther off the true unemployment rate than usual. Several facts support this suspicion.
Small sample size
The federal government's monthly survey of Indiana contacts only about 800 households. In a typical month this year, about 25 people reported themselves as unemployed in this survey. In September, only 12 people said they were unemployed. Based on those 12 responses, the formulas came up with an estimated statewide unemployment rate of 2.1% (not seasonally adjusted).
In other words, just a tiny handful of people was the basis for the big drop in the unemployment rate.
Abnormal one-month drop
Not only was Indiana's unemployment rate at a record low in September, but it also showed a record one-month drop. August's rate was 3.3% (not seasonally adjusted), which was about average for the year 2000 so far (see Table 1). That means in September, Indiana's unemployment rate dropped 36%—in one month. During the last 10 years, there have been only a few instances of double-digit monthly change in the rate. The largest one up to now was just 19%, the rise in the rate from December 1998 to January 1999.
Where did the people go?
After the formulas calculate the unemployment rate percentage for the month, that percentage is used to estimate the number of people who were unemployed. In every month so far this year, the estimated number of unemployed has been around 100,000 people (Table 1). August's estimate was a little more than 104,000. In September, though, the number fell below 66,000. Is it likely that about 35,000 people suddenly found work in one month, after being unemployed all year?
Within normal variation
At first glance, it seems unlikely that the state's unemployment rate would change so much over the course of one month. It is possible, though, to judge how likely it is that the calculated rate would change that much while the actual number of unemployed people did not change. Maybe even with an unemployment rate around 3% the survey has a good chance of estimating it at 2.1%.
One way to look at this possibility would be to use the normal margin of error calculated by BLS for its unemployment survey. The survey must use a small sample size in Indiana partly because of federal budget cuts. Even so, experts at BLS and DWD have designed the calculation so that it is accurate to within a commendably narrow range.
There is, however, no published margin of error for the monthly survey. The annual average unemployment number is said by BLS to be accurate to within plus or minus about 16,000 people. (That range represents about a 10% confidence interval.)
A margin of plus or minus 16,000 people applies to the annual average, though, which exhibits far less variability than the monthly numbers. We don't know what the normal margin of error would be for the monthly numbers. Presumably it would be at least two or three times larger than the annual interval, so a difference of 35,000 people in one month is within the expected range.
Seen another way, suppose the true, statewide unemployment rate in September was 3%, no different from the average so far this year. That means there should be 24 unemployed people in the federal survey's sample of 800 people in Indiana. But it's such a small sample. What are the chances of finding only 12 unemployed people in that small sample?
There are more than 3 million people in the labor force in our state. About 100,000 are unemployed, so how many unemployed will show up if we pick a sample of just 800 out of the 3 million? Obviously, sometimes we'll get 24 unemployed people in the sample. But by picking a sample of only 800, sometimes we won't find 24 unemployed people in one particular sample. Sometimes we might get 26, or 20, or 29, or 16. We might even get only 12. According to normal probabilities, the chances of getting only 12 are somewhere between one in 10 and one in 20. Once every couple of years, then, the monthly survey easily could be that far off. It would be considered normal variation. Therefore, it's safe to say that September's unemployment level could have been unchanged from August.
So did Indiana's unemployment rate really take a major drop in September? Or did normal variation in the sample throw off the estimating formulas? We don't know. All we know is that the formulas came up with an estimate of 2.1% for September, but that estimate is within the expected variation around a 3% average.
October's results will not help us decide, either: Most of the 800 people contacted for the federal survey in October were the same people contacted in September.


