Trends in High-Tech: Workers, Wages and Establishments
Employment in high-technology industries in Indiana grew from 243,860 in third quarter 1994 to 277,313 in third quarter 1999, according to covered employment and wage data from the Indiana Department of Workforce Development. This represents an employment increase of 33,453, or 13.7%, during the five-year period, compared with overall employment growth of 9.4% for the state.
This article uses the BLS definition of high-tech industries. See IN the Spotlight for more details on high-tech classification. The figures in this article do not correspond exactly with the figures in "IN the Spotlight" because each article uses a different data set within a different time frame.
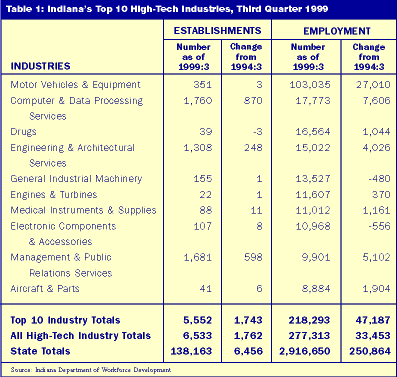
High-tech industries accounted for larger shares of the state's total employment and wages in third quarter 1999 (9.5% and 15.4%, respectively) than they did five years earlier (9.1% and 14.2%). Table 1 lists the state's top 10 high-tech industries (by employment) in third quarter 1999.
Click on table to see larger version.

Average weekly wages for all high-tech industries in the state were higher than the state average of $564 for third quarter 1999. The drugs industry led with average wages that were almost 2.5 times the state average. Together, the 10 top high-tech industries paid, on average, $935 per week—more than 1.6 times the state figure.
The state experienced total employment growth of 52,020 in 17 high-tech industries and an employment decline of 18,567 in 14 high-tech industries for net employment growth of 33,453 over the five-year period. Motor vehicles and equipment accounted for 52% of the employment growth, while household audio and video equipment accounted for 66% of the employment decline in the high-tech industries. Household audio and video equipment, which had been the second-largest high-tech employer in the state in 1994, dropped out of the top 10 by 1999 to 12th place, as employment in the industry fell from 19,135 in 1994 to 6,808 in 1999.
Changes in employment between third quarter 1994 and third quarter 1999 for the current top 10 high-tech employers in the state are shown in Table 1. The largest employment growth was in motor vehicles and equipment, followed by three service-division industries that are considered to be high-tech: computer and data processing services, management and public relations services, and engineering and architectural services.
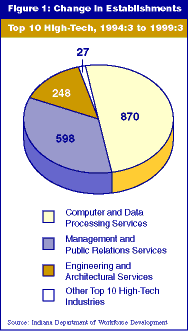
Almost all of the growth in the number of high-tech establishments between 1994 and 1999 came from the high-tech service industries, as shown in Figure 1. The number of establishments in the computer and data-processing services industry grew from 890to 1,760, for a growth rate of 98%. Rapid growth rates were also experienced by management and public relations services (55%) and engineering and architectural services (23%). The total number of establishments in the state grew by 4.9% during the same five-year period.

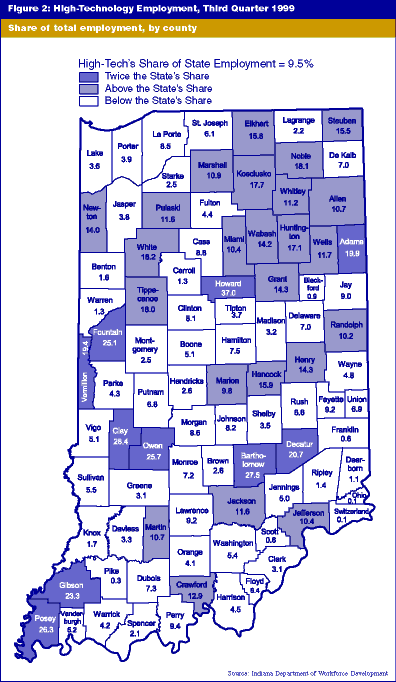
Overall for the state, 9.5% of employment in third quarter 1999 was in high-tech industry. Figure 2 highlights those counties whose high-tech share of employment exceeds the state figure. Counties with the largest shares of employment in high-tech industries are Howard (37%), Clay (28.4%), Bartholomew (27.5%) and Posey (26.3%). Howard and Bartholomew counties are home to several auto and electronics firms including DaimlerChrysler, Delphi Delco Electronics, Cummins Engine, Arvin Industries and Onkyo. General Electric has a large plastics firm in Posey County while Great Dane resides in Clay County. Counties with the smallest shares of employment in high-tech industries are Ohio (0.1%) and Switzerland (0.1%).

