Indiana Recaptures Manufacturing Employment Strength
June 2000 preliminary figures from the U.S. Bureau of Labor Statistics estimate manufacturing employment at 696,900 workers, or 23.2% of Indiana's total nonfarm employment. The data, collected through the Current Employment Survey, show that jobs in manufacturing have increased by 0.2% since June of last year and are 1% higher than the 1999 annual average.
A Historical Perspective
Manufacturing employment in Indiana exploded in 1941 when the United States entered World War II, resulting in a 24.3% increase over 1940 (see Figure 1). By the time peace was restored in 1945, Indiana's manufacturing employment had increased by 53%.
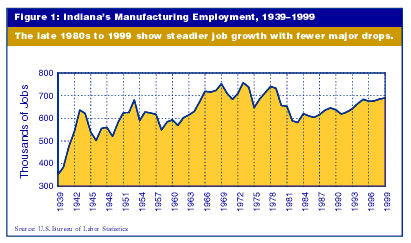
During the war years, employment peaked for Indiana manufacturing in 1943 at an annual average of 636,500, almost double 1939 levels. This peak was not exceeded until 1953, the last year of the Korean War (681,400 workers). By the next year, however, average employment in manufacturing dropped by 13.4%. The 1943 level was not exceeded again until 1965. Employment remained above the 1943 level from 1965 until 1982, when it dropped by 9.75% in one year. Since 1988, employment has again exceeded the World War II peak, with the exception of 1991 and 1992, which coincide with the latest recession.
The highest level of manufacturing employment, however, occurred in 1973, with annual average employment reaching 758,200, 8.8% higher than current manufacturing employment and 19% higher than the World War II peak. Other peak years were 1969 (752,300) and 1978 (741,500). The lowest employment since the 1973 peak occurred in 1983. In 1982, manufacturing employment averaged 78% of 1973 levels, and in 1983 it was 77% of the 1973 average. During the 1990s, average manufacturing employment levels were lowest in 1991 (82% of 1973 peak) and highest in 1999 (91% of 1973 peak).
Manufacturing employment in Indiana has hovered around 3.5% of total U.S. manufacturing employment since 1948, the earliest year of U.S. data analyzed (see Figure 2).
Click on chart to see larger version.
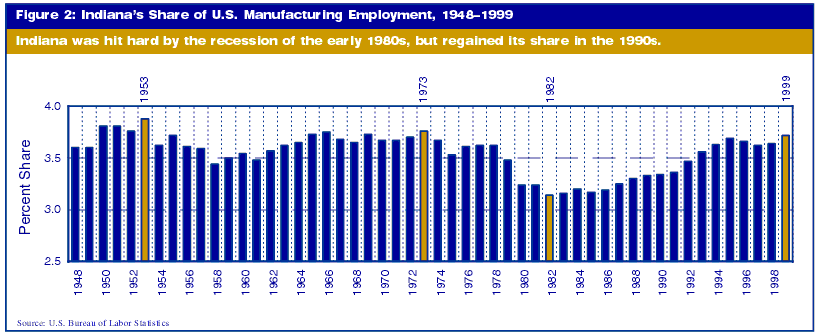
In 1953, Indiana had its highest share of the national manufacturing workforce, 3.88%. Not surprisingly, this was also a peak employment year for Indiana. Indiana's share of manufacturing employment in the United States reached its lowest point (3.14%) in 1982, a recession year.
Indiana constituted 3.72% of all U.S. manufacturing employment in 1999, the only year since 1973 (3.76%) in which the state came close to reaching its 1953 level of 3.88%.
Manufacturing Wages
(1989-99 Annual Averages, June 1989-June 2000)
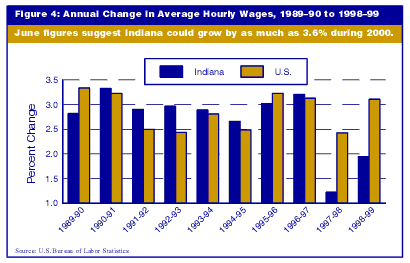
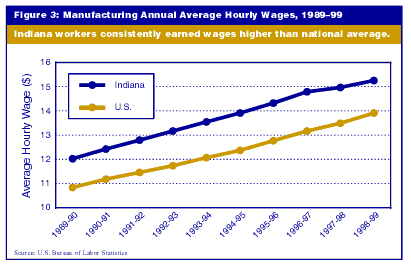
During the last decade, Indiana's manufacturing workers earned consistently more than the national average (see Figure 3). Average hourly wage rates for June 2000 were $15.81 in Indiana and $14.32 in the nation. In 1997, Indiana manufacturing workers earned an average of $1.62 more per hour than the average worker in the United States. In 1999, this difference fell back to $1.35, but in June 2000, the Indiana wage differential expanded again to $1.49. From June 1999 to June 2000, Indiana's annual average hourly manufacturing wages have increased by 3.54%. This is the highest rate of increase in the last three years, and if sustained throughout the year, will result in the highest rate since 1990.
For six of the 10 years between 1989 and 1999, manufacturing wages grew faster in Indiana than in the nation (see Figure 4). Between 1997 and 1999, however, wage growth in Indiana lagged behind the nation. The 1999 annual average wage for manufacturing workers in Indiana increased by 30.4% from 1989. The U.S. annual average wage increased by 32.7% for the same period, but still remains well below the Indiana average.