Employment Growth Reflects Geographic Differences
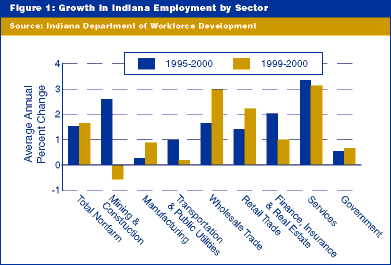
In the past year, Indiana's employment grew by 1.7%, up slightly from the annual rate of 1.5% over the past five years. (All data refer to the month of February.) The fastest-growing sector has been services in both time periods.

The 1999-2000 period was distinguished by the strong performance of manufacturing, wholesale and retail trade relative to the longer 1995-2000 period. These disparities by sector, however, are less than the geographic disparities within the state.

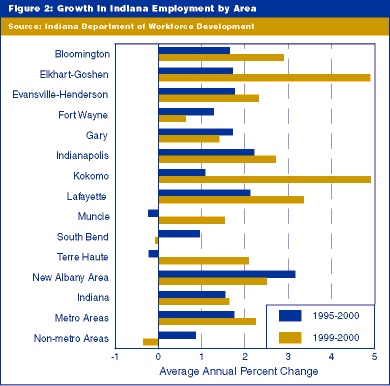
The 11 metropolitan areas of the state (with 77% of total employment) have averaged a 1.75% annual growth rate over the past five years, while the nonmetro areas have grown at about half that rate at 0.85%. In the past year, the disparity increased as metro areas grew by 2.2% and nonmetro area employment decreased by 0.4%.
The New Albany area (a portion of the Louisville MSA) led the state with a 3.2% increase over the past five years, followed by Indianapolis and Lafayette. The minor decreases shown for Terre Haute and Muncie may be treated as approximating "no change" because they are based on relatively small samples. The Kokomo and Elkhart-Goshen areas were the growth leaders in the past year, with only South Bend not increasing in number of jobs.
Sector Leaders
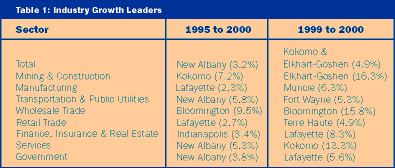
New Albany's employment growth rate led all MSAs in three of the eight sectors from 1995 to 2000. Lafayette also captured the top spot in two other sectors. In the past year, employment growth has been broadly dispersed, with eight different metro areas taking the lead in different sectors.

Metro/Nonmetro Differences
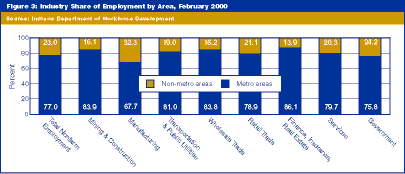
Although metro areas have more than three-quarters of all Hoosier employment, they host slightly more than two-thirds of manufacturing jobs. The metro areas' greatest hold on employment is in the financial sector, where they account for more than 86% of jobs.

